How to format charts in google slides
Steps
-
1.
Open google slides
-
2.
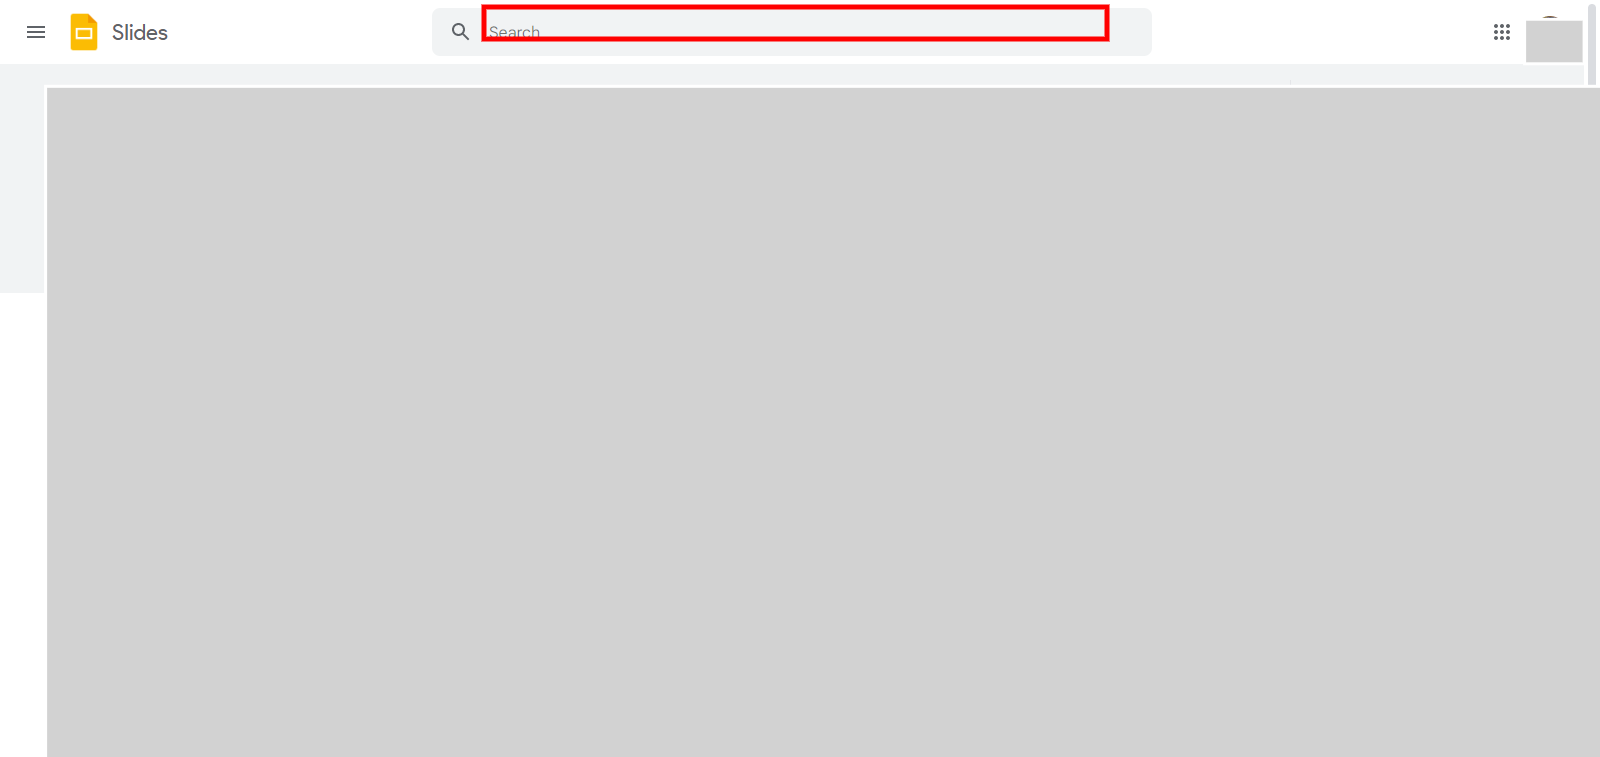
1.Click on search bar and type the file name and hit enter and press the next button.
-
3.
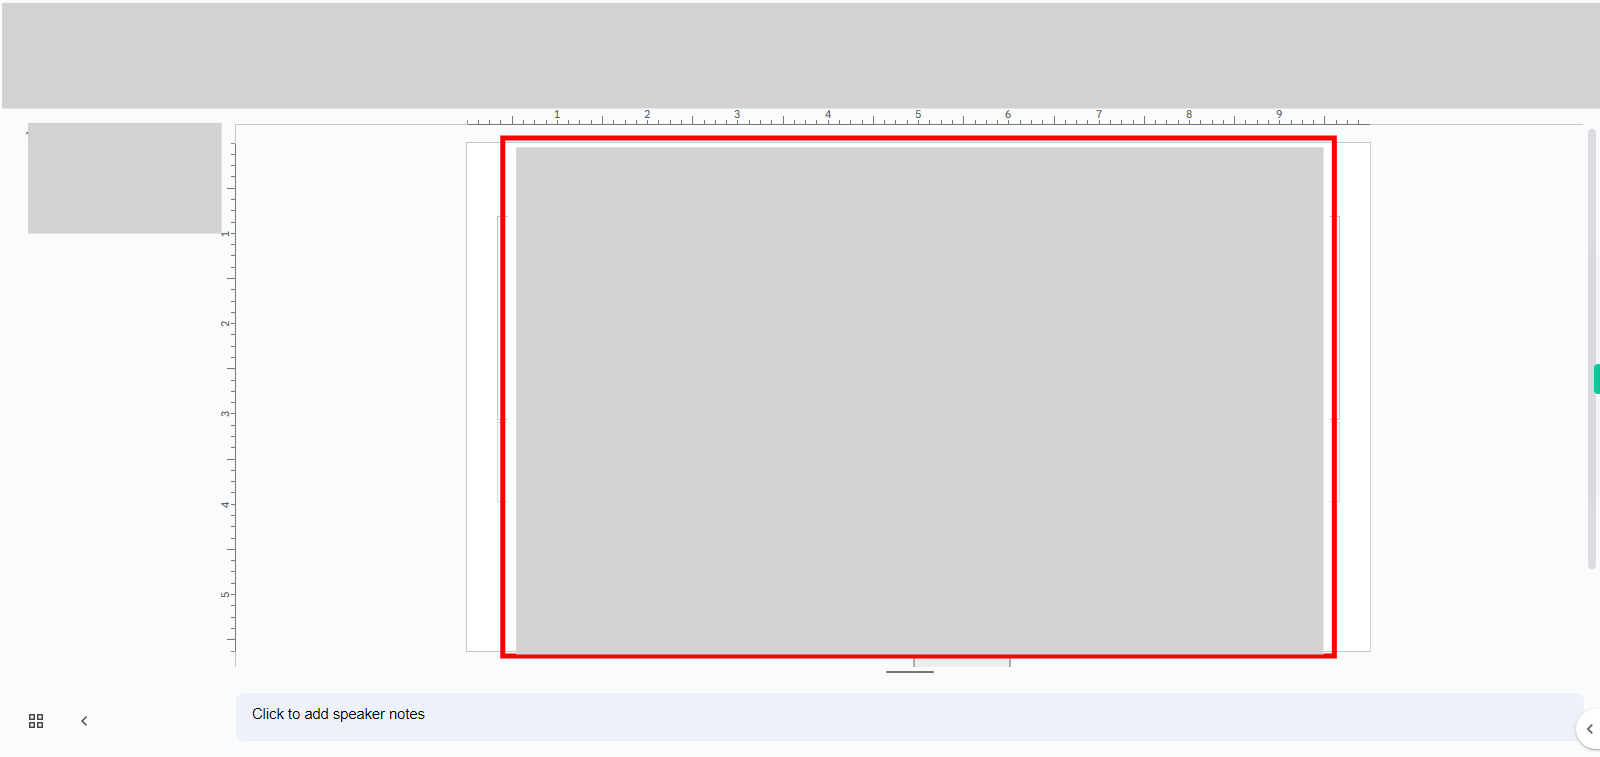
2.Click on the chart to be formated.Once done Click on the "Next" button on Supervity instruction Widget.
-
4.
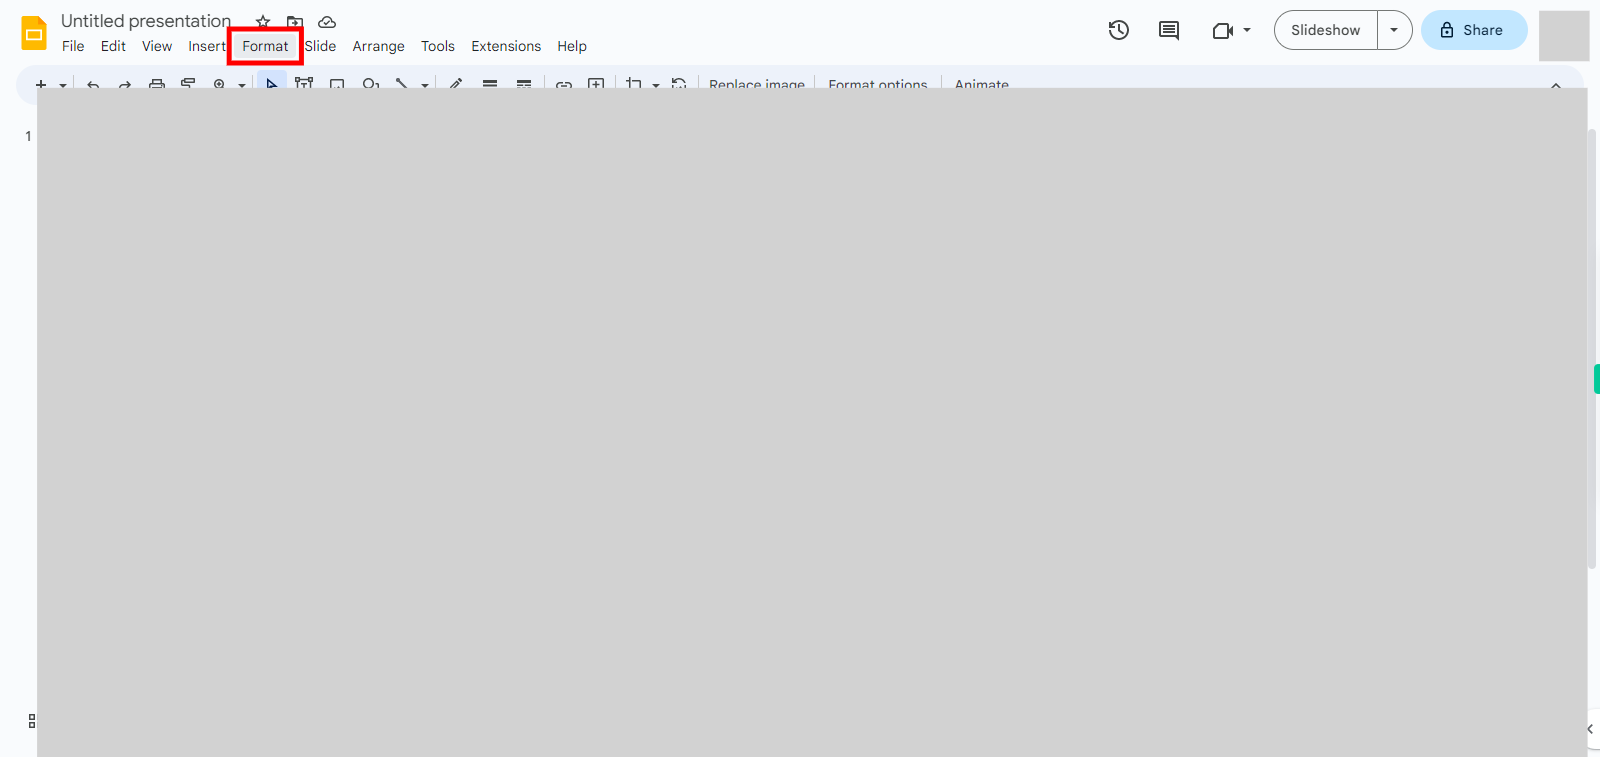
3.Click on format, select the formating options manually and click on next.
-
5.
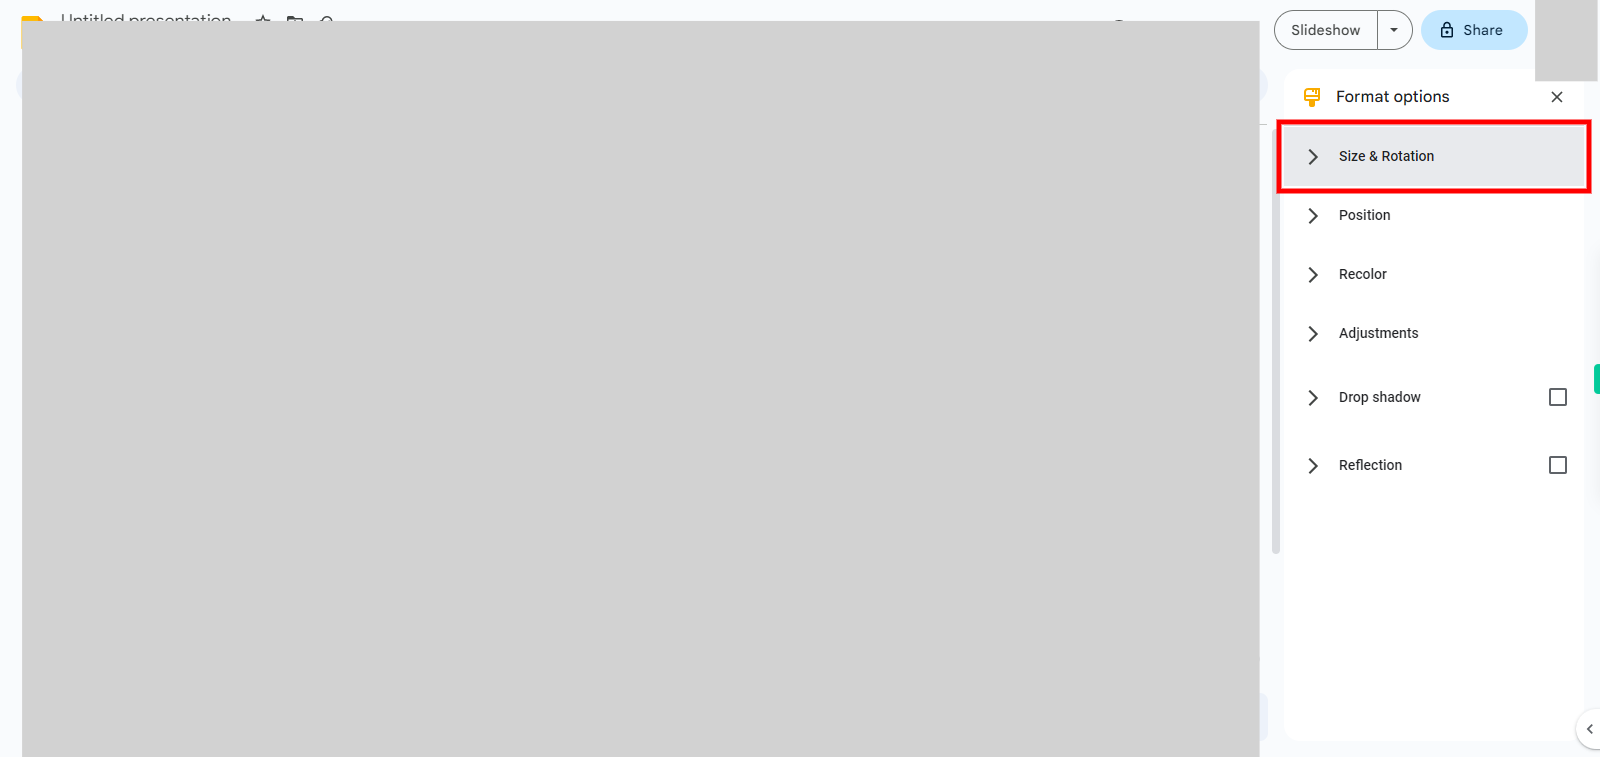
4.Click on size & rotation and then select the required formating options and click on next .
-
6.
5.Click on position and then select the required formating options and then press next.
-
7.
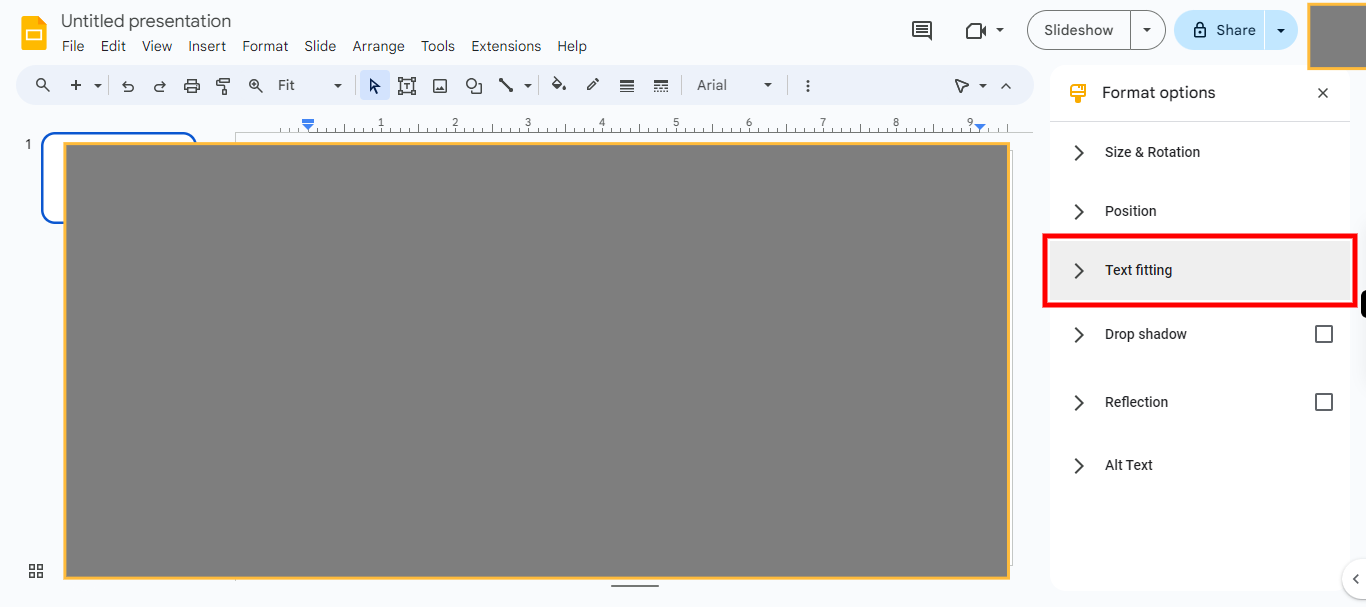
6 .Click on "Text fitting" and add required formating options and click on next.
-
8.
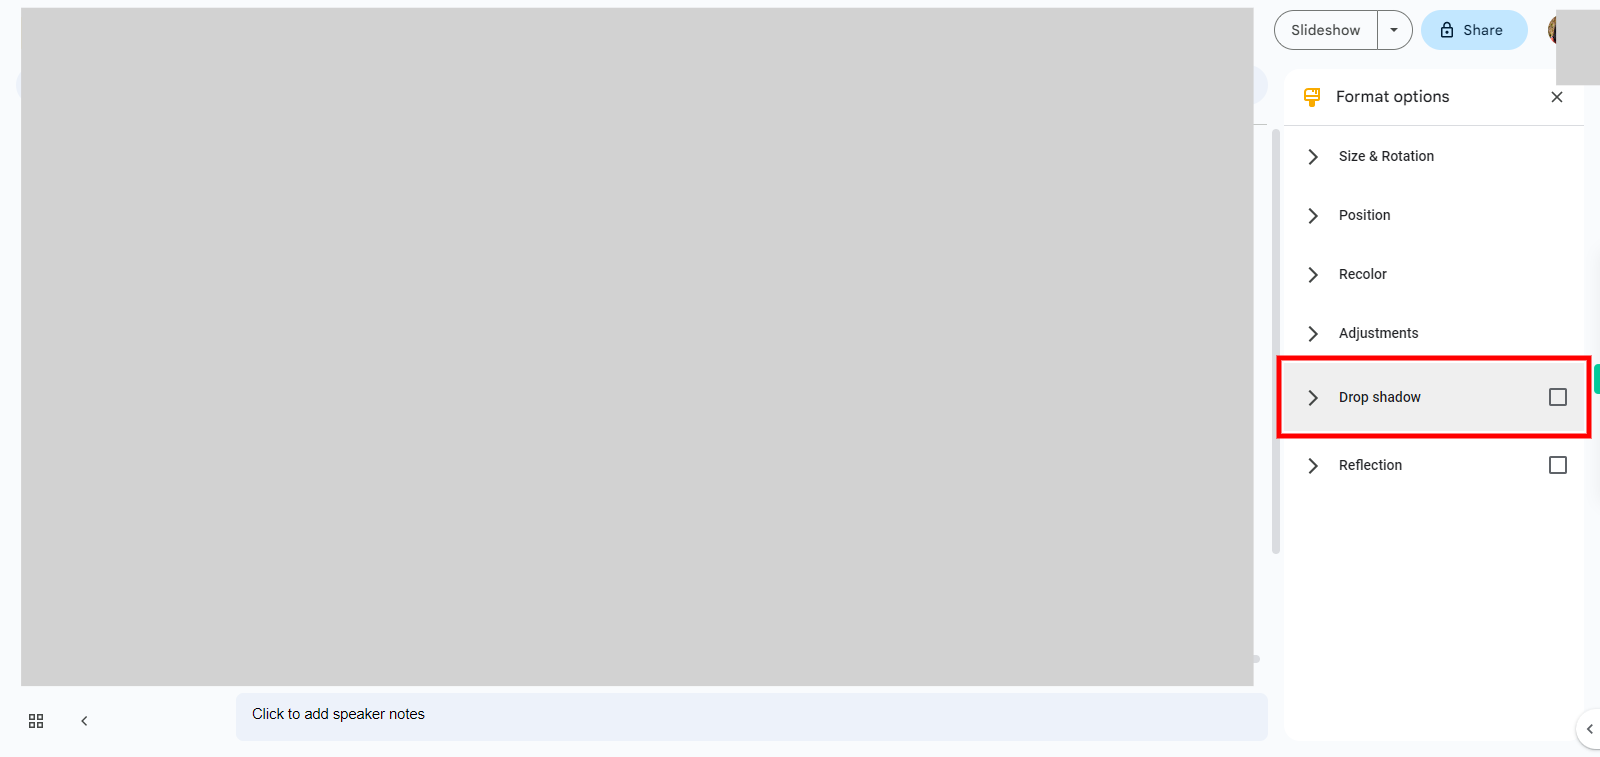
7.Click on drop shadow and add required formating options click on next.
-
9.
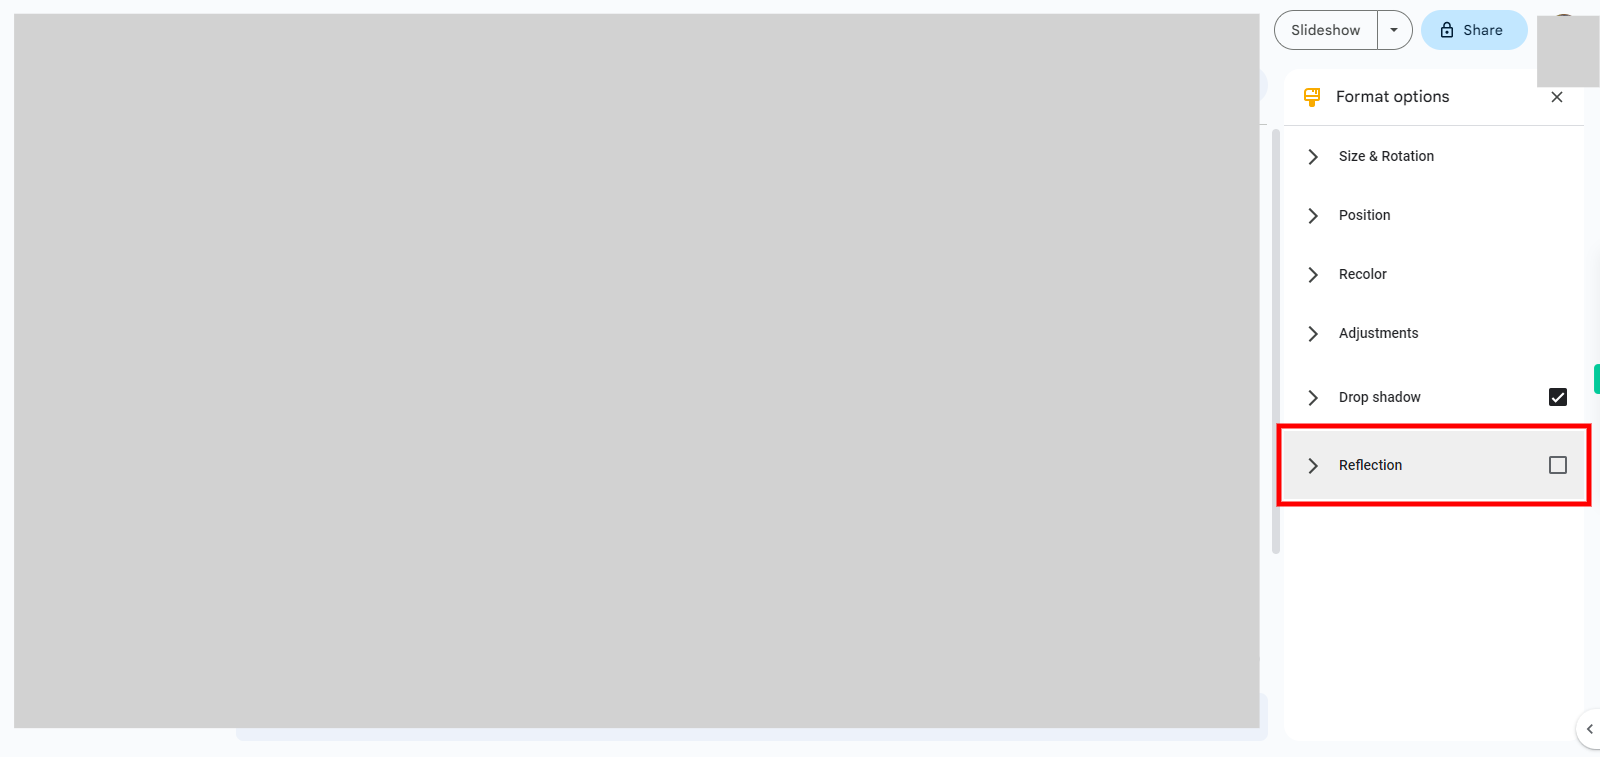
8.Click reflection and add required formating options then close.


