Step by step process of inserting charts and graphs into an existing Google Sheet. Inserting charts and graphs in Google Sheets allows users to visually represent and analyze data, making it easier to identify patterns, trends, and relationships at a glance, thereby enhancing data comprehension and decision-making. NOTE: Please ensure that you have already logged into the Google Sheets web application before using this skill, and that you have an existing Google Sheet with data.
-
1.
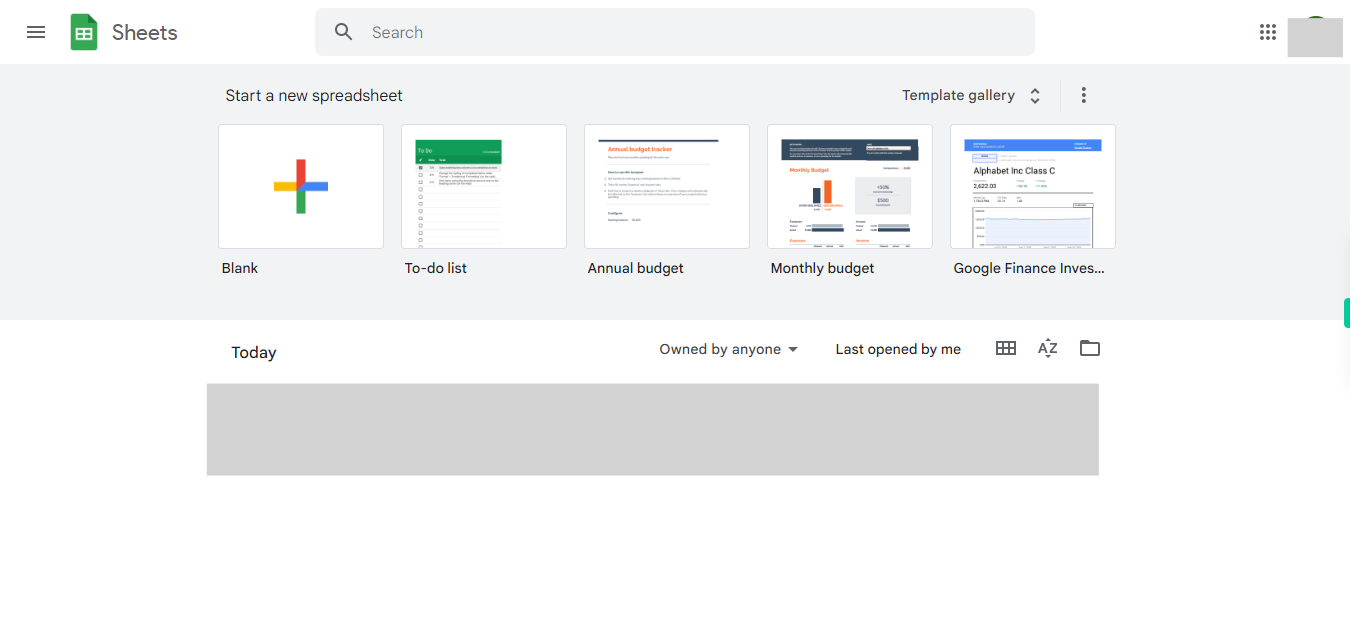
Open Google Sheets web application.
-
2.
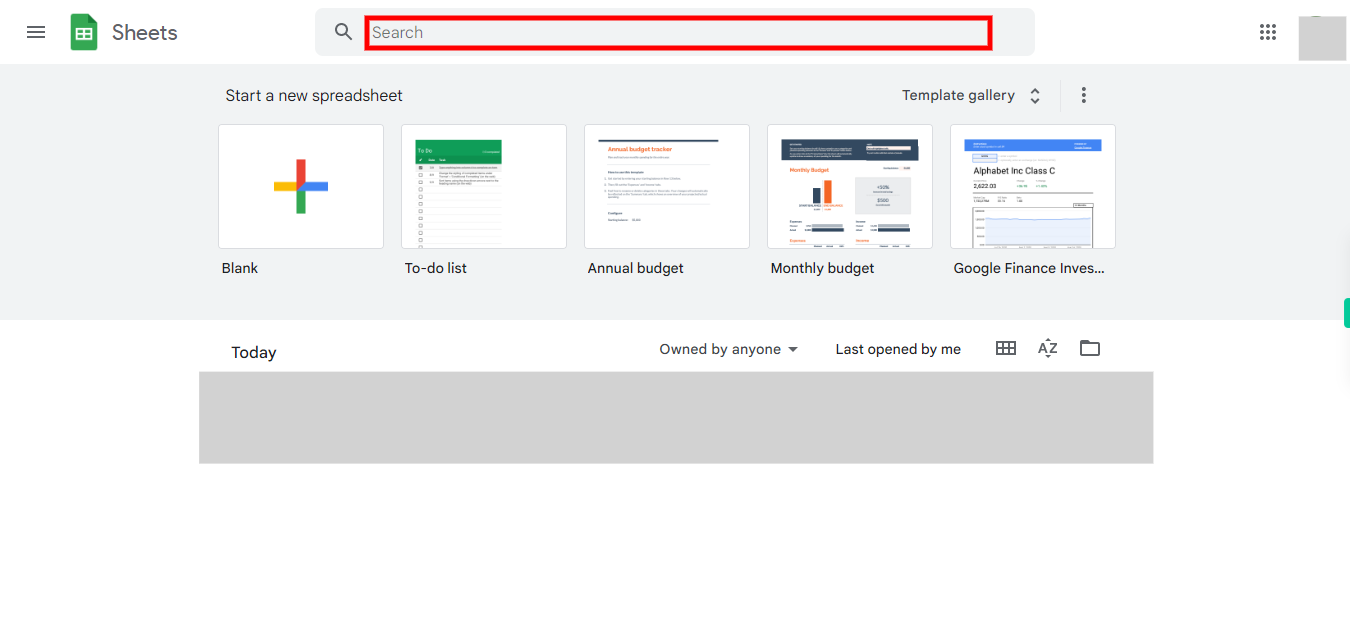
Click on the "Next" button in the Supervity instruction widget, then search for and open the necessary Google Sheet that contains the data for which charts or graphs need to be included.
-
3.
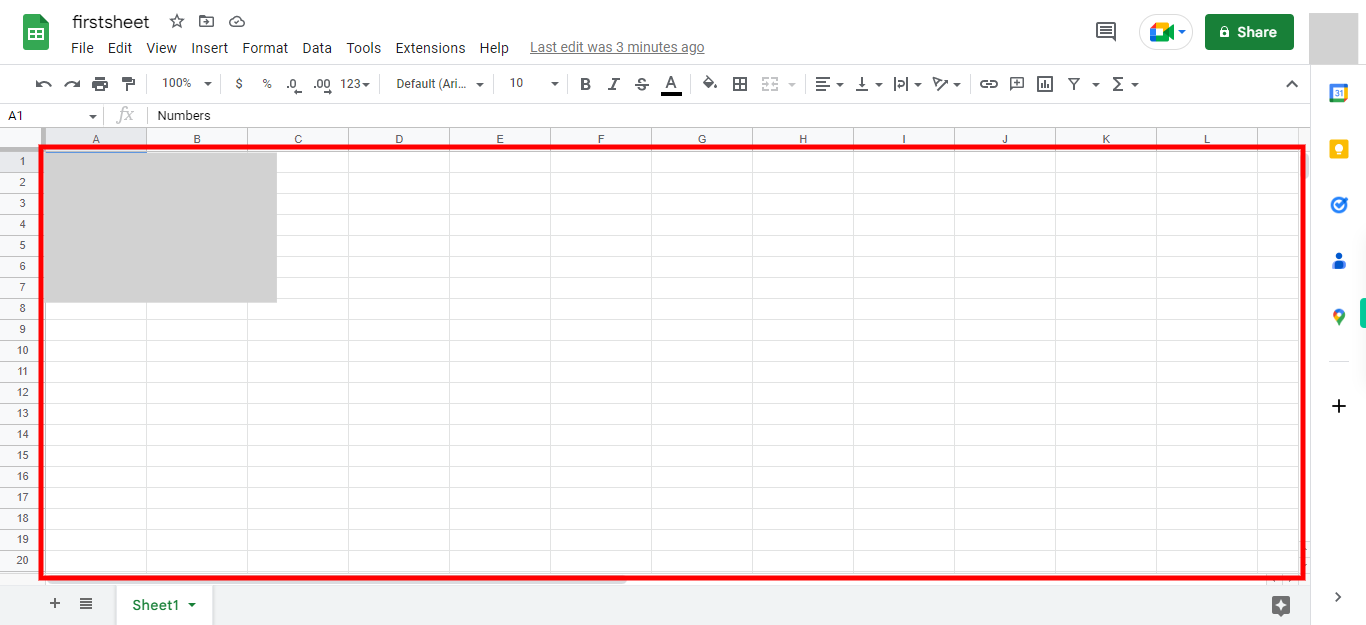
Select the specific data that you want to convert into a chart. Afterward, click on the "Next" button within the Supervity instruction widget.
-
4.
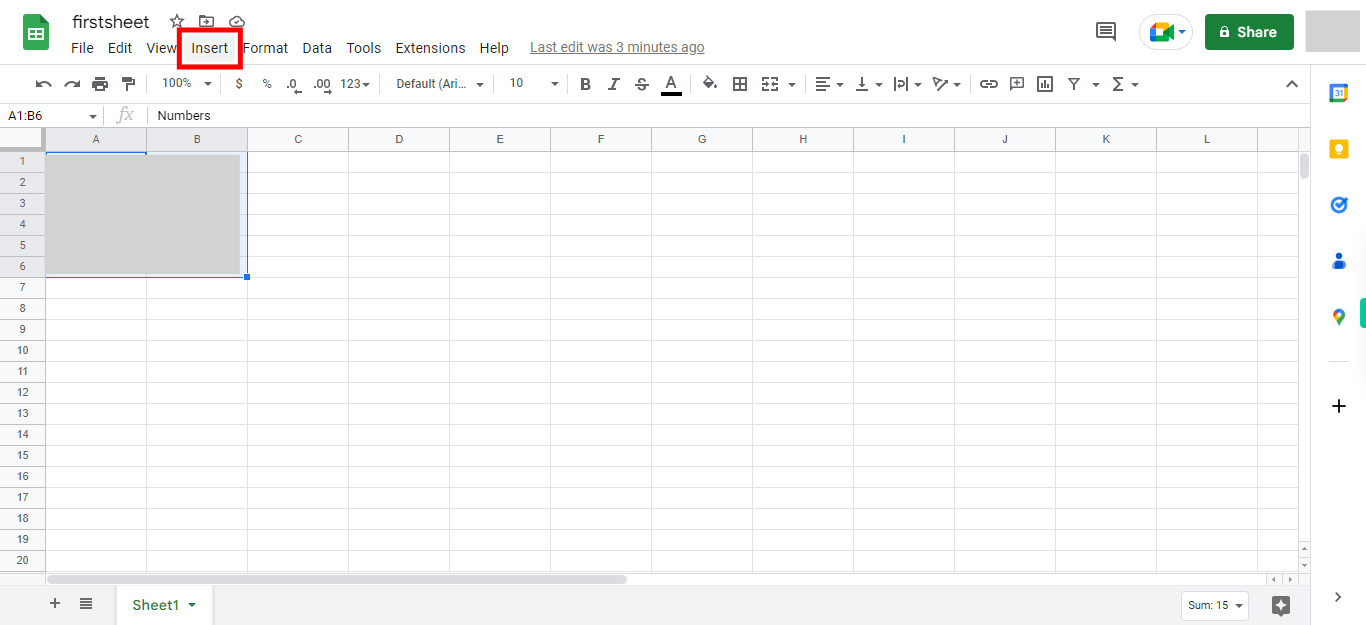
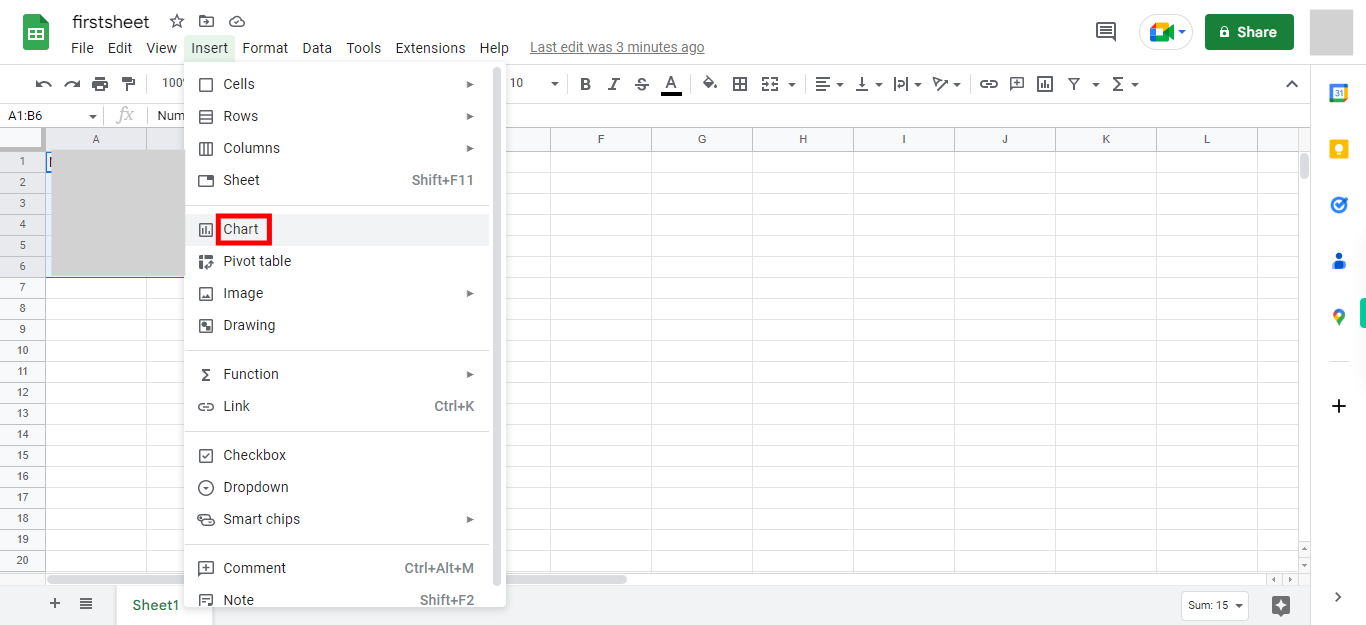
Now, click on the "Insert" menu to access and view the available options under this menu. This menu provides various functions and tools for inserting different elements, such as charts, graphs, images, and more, into your document.
-
5.
From the dropdown of different options in the Insert menu, locate and click on the "Chart" icon. After a brief moment, the selected data will be displayed in a chart format, allowing you to visualize and analyze the information more effectively.
-
6.
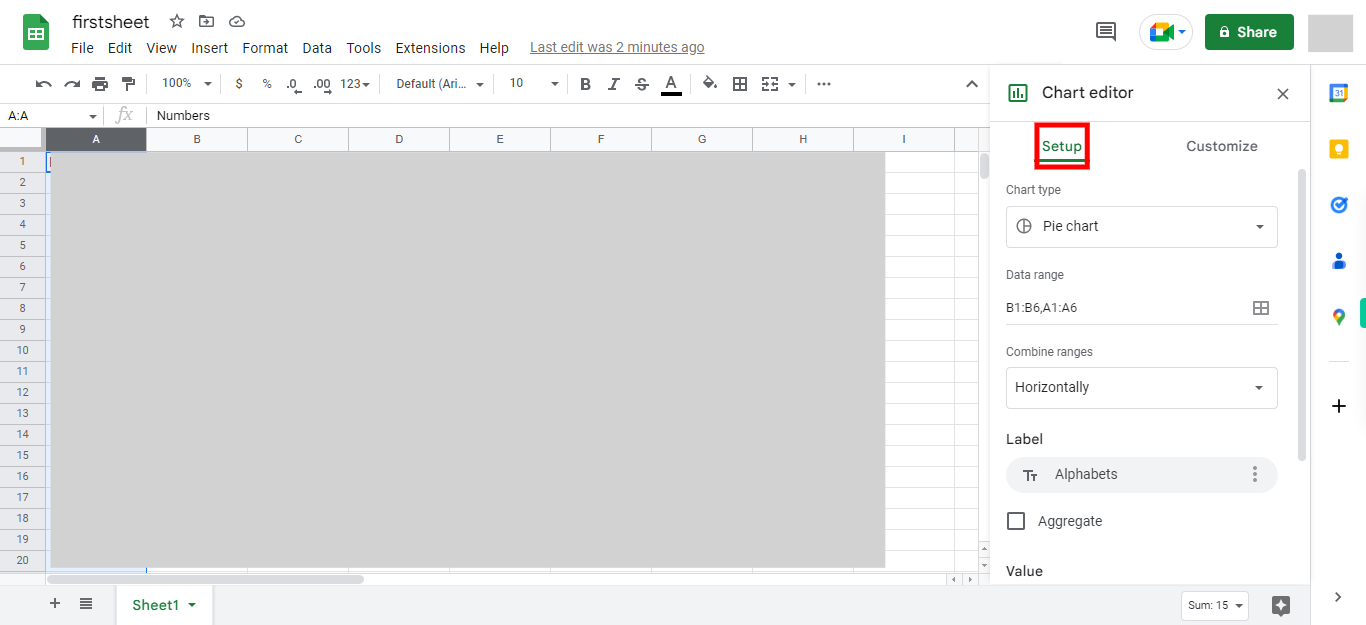
Now navigate to the "Setup" option in Google Sheets, you can configure the initial settings and layout of your worksheet or document. In the "Setup" menu, you will typically find a range of features to adjust, such as page orientation, margins, paper size, headers and footers, and other formatting elements. Choose the specific features you want to customize based on your specific requirements. Once you have completed the customization, click on the "Next" button in the Supervity instruction widget to proceed further.
-
7.
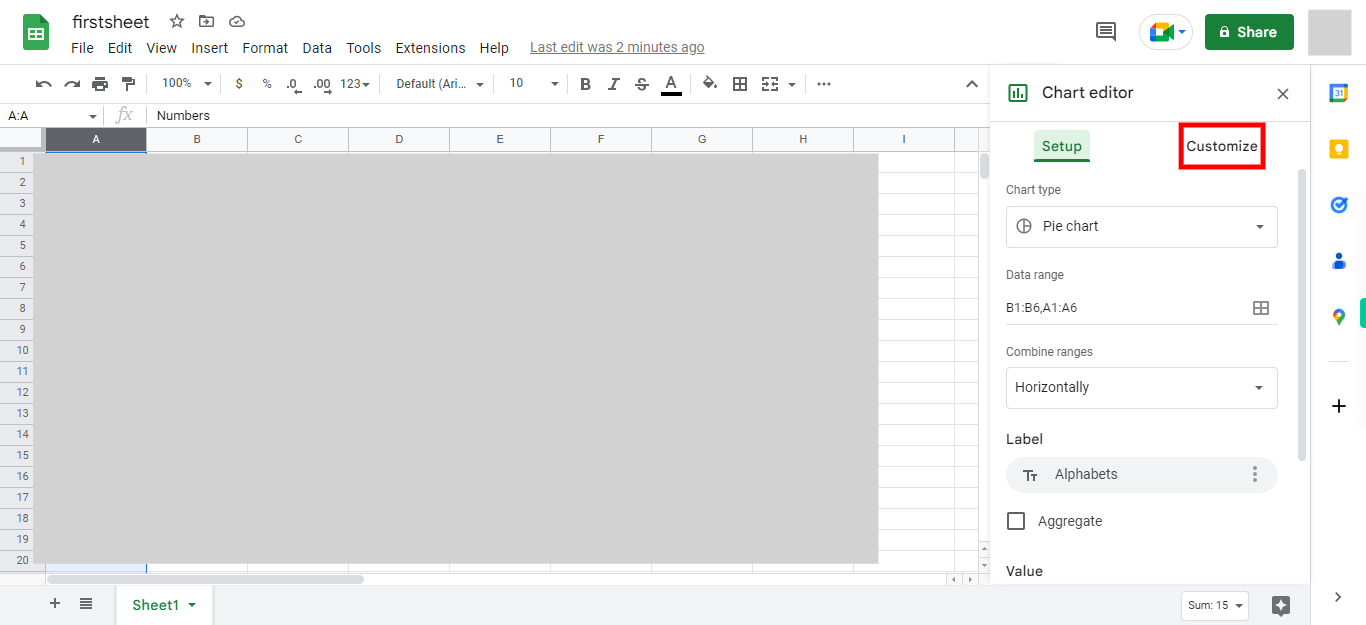
Click on the "Close" button in the Supervity instruction widget. After that, locate and access the "Customize" option in Google Sheets. This feature provides a variety of settings and options for personalizing and modifying different aspects of your spreadsheet. Within the "Customize" menu, you can select the desired features that you wish to customize, such as fonts, colors, borders, cell formatting, conditional formatting rules, data validation, and more. Choose the specific features you want to modify based on your preferences and requirements.


